Mincheol Kim (MSc Data Science, 2023)
Having completed over half of my graduate courses and approaching graduation, I wanted to write a thesis in a field that heavily utilized machine learning and deep learning, rather than relying on traditional statistical analysis methods. This felt more aligned with the purpose of my graduate education in data science and artificial intelligence, making the experience more meaningful.
Data Accessibility and Deep Learning Applicability
Like many others, I struggled to obtain data. This led me to choose a field where data was accessible, but conventional methods failed to uncover meaningful insights. In graduate school, we weren't restricted to specific topics. Instead, we learned a variety of data analysis methods based on mathematical and statistical principles. This flexibility allowed me to explore different areas of interest.
I eventually chose topic modeling with deep learning as the subject of my thesis. I selected topic modeling because deep learning methodologies for this field have developed well, moving beyond statistical logic to generative models with layered structures of factor analysis, which trace underlying structures based on data probability. Moreover, there were many excellent researchers in Korea working in this field, making it easier to access good educational resources.
Korea's high dependency on exports
During a conversation with my mentoring professor, he suggested, "Instead of focusing on the analysis you're interested in, why not tackle an AI problem that society needs?" Taking his advice to heart, I started exploring NLP problems where I could make a meaningful contribution, using the IMRaD approach. This search led me to a research paper that immediately caught my attention.
The paper highlighted that while Korea has a globally respected economic structure, it remains heavily dependent on foreign markets rather than its domestic one. This dependency makes Korea's economy vulnerable to downturns if demand from advanced countries decreases. Furthermore, recent trade tensions with China have significantly affected Korea's trade sector, emphasizing the need for export diversification. Despite various public institutions—such as KOTRA, the Korea International Trade Association, and the Small and Medium Business Corporation—offering services to promote this diversification, the paper questioned the overall effectiveness of these efforts. This issue resonated with me, sparking ideas on how AI could potentially offer solutions.
Big Data for Korean Exports
The paper's biggest criticism is that the so-called 'big data services' provided by public institutions don't actually help Korean companies with buyer matching. Large companies that already export have established connections and the resources to keep doing so without much trouble. However, small businesses and individual sellers, who lack those resources, are left to find new markets on their own. In this context, public institutions aren't providing the necessary information or effectively helping with buyer matching, which is critical for improving the country's economy and competitiveness.
While the institutions mentioned do have the experience, expertise, and supply chains to assist many Korean companies with exporting, the paper highlights that their services aren't truly utilizing big data or AI. So, what would a genuine big data and AI service look like—one that leverages the strengths of these institutions while truly benefiting exporters and sellers? The idea I developed is a service that offers 'interpretable' models, calculations, and analysis results based on data, providing practical support for decision-making.
LDA does not capture 'context'
When I think about AI, the first professor who comes to mind is Andrew Ng. I’m not sure why, but at some point, I started noticing more and more people around me mentioning his lectures, interviews, or research papers. Given that his work dates back to the early 2000s, I might have come across it later than many others. Interestingly, the topic modeling in my thesis traces back to Professor Ng’s seminal paper on Latent Dirichlet Allocation (LDA).
In LDA, the proportion (distribution) of topics is assumed to follow a beta distribution, and based on this assumption, the words in each document are temporarily assigned to topics. Then, prior parameters are calculated from the words in each topic, and the changes are measured using KL-divergence. The topic assignments are repeatedly adjusted until the changes narrow and the model converges. Since LDA uses Gibbs sampling, it differs significantly from Neural Network Variational Inference (NVI), which I will explain later.
Simply put, the goal of LDA is to identify hidden topics within a collection of documents. The researcher sets the number of topics, $k$, and the LDA model learns to extract those topics from the data.
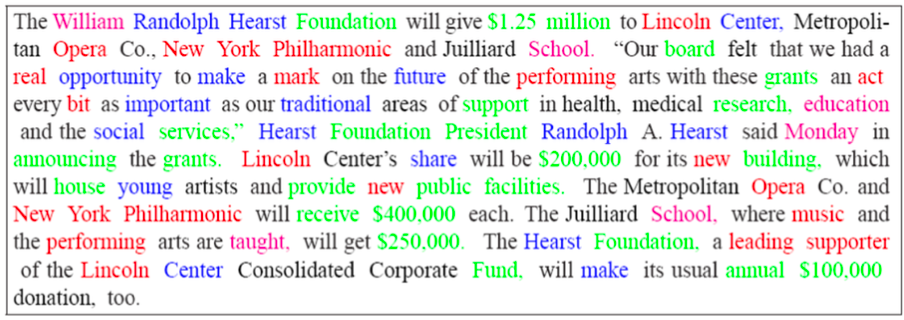
The biggest flaw in LDA is that it assumes the order and relationship of words are conditionally independent. In other words, when using LDA, the next word or phrase can be assigned to a completely different topic, regardless of the conversation's context. For example, you could be discussing topics B and C, but the model might suddenly shift to topic A without considering the flow of the discussion. This is a major limitation of LDA — it doesn’t account for context.
LSA uses all the information
On the other hand, Latent Semantic Analysis (LSA) addresses many of LDA's weaknesses. It extracts the relationships between words, words and documents, and documents and documents using Singular Value Decomposition (SVD).
The principle is simple. In a set of documents, the co-occurrence of words is represented on a graph. By decomposing an $n \times m$ matrix with SVD, we can extract eigenvectors representing words and documents. These eigenvalues show the significance of each word or document within the context of the vector space.
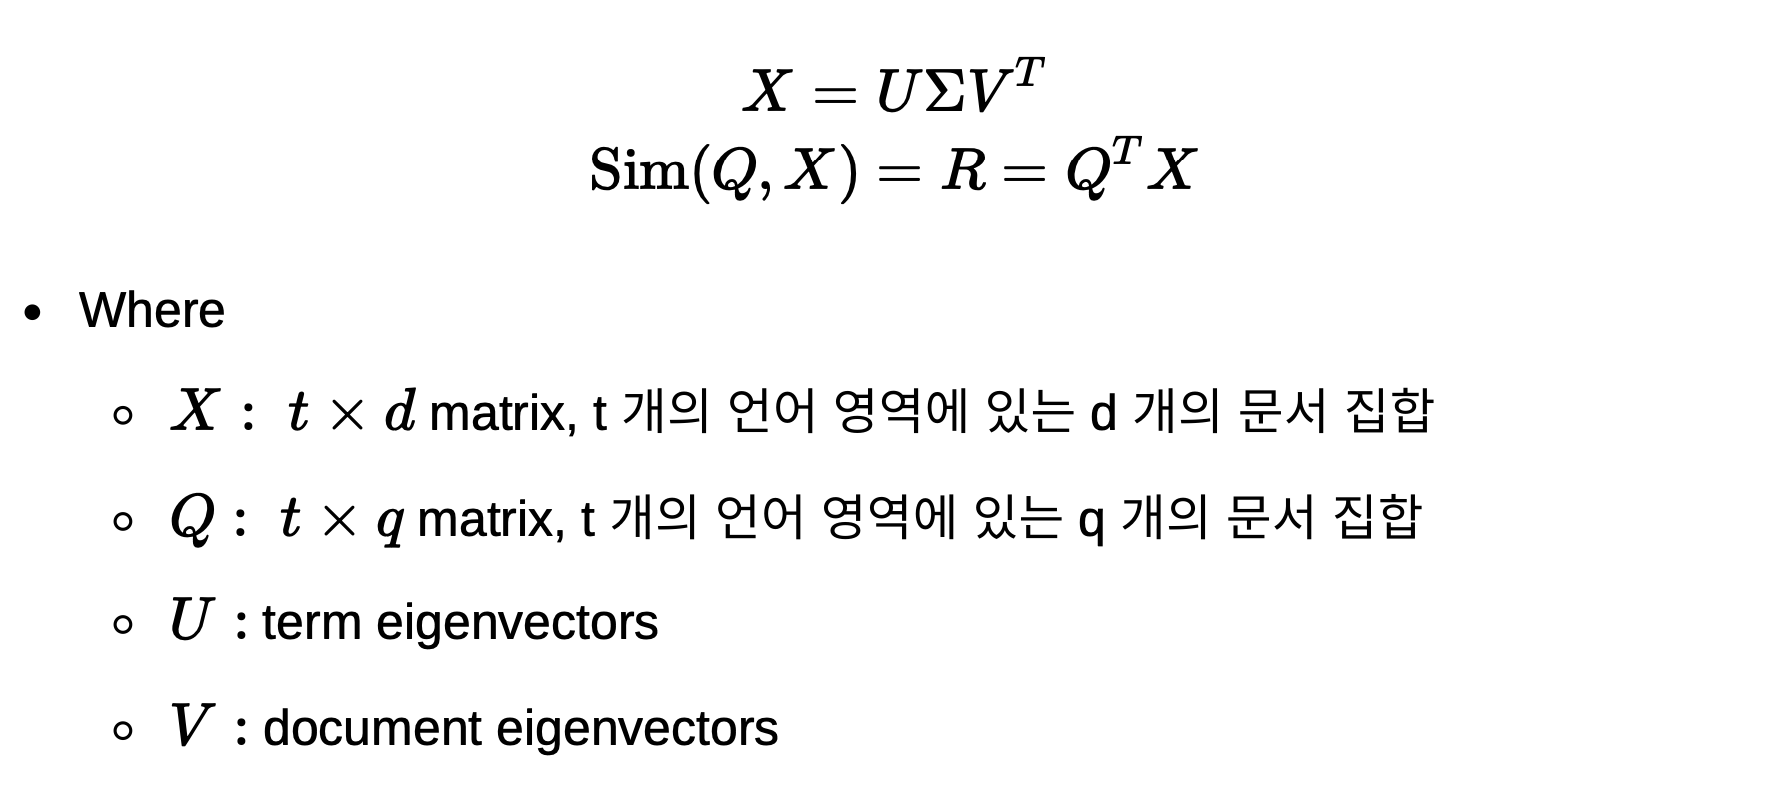
Although LSA is a basic model that relies on simple SVD calculations, it stands out for utilizing all the statistical information from the entire corpus. However, it has its limitations. As mentioned earlier, LSA uses a frequency-based TF-IDF matrix, and since the matrix elements only represent the 'occurrence count' of a word, it struggles with accurately inferring word meanings.
GloVe: Contextual Word Embeddings
A model designed to capture the word order, or 'contextual dependency,' between words is Global Vectors for Word Representation (GloVe). Unlike Word2Vec, which focuses on context but doesn't fully leverage all the information from the document, GloVe was developed to address this limitation while retaining the strengths of both approaches. In essence, GloVe reflects the statistical information of the entire corpus and uses dense representations that allow for efficient calculation of word similarities. The goal of GloVe is to find embedding vectors that minimize the objective function $J$, shown below.

To bypass the complex derivation of GloVe's objective function $J$ and focus on the core idea, GloVe can be summarized as aiming to make the dot product of two embedded word vectors' correspond to the co-occurrence probability of those words in the entire corpus. This is done by applying least squares estimation to the objective function, with the addition of a weighting function $f(X_{ij})$ to prevent overfitting, which is a common issue in language models.
The GloVe model requires training on a large, diverse corpus to effectively capture language rules and patterns. Once trained, it can generate generalizable word representations that can be applied across different tasks and domains.
The reason for highlighting the evolution of topic modeling techniques from LDA to GloVe is that GloVe's embedding vectors, which capture comprehensive document information, serve as the input for the core algorithm of this paper, Graph Neural Topic Model (GNTM).
Word Graph: Uncovering Word Relationships
The techniques we've explored so far (LDA, LSA, GloVe) were all developed to overcome the limitations of assuming word independence. In other words, they represent the step-by-step evolution of word embedding methods to better capture the 'context' between words. Now, taking a slightly different approach, let's explore Word Graphs to examine the relationships between words.
Both GloVe and Word Graph aim to understand the relationships between words. However, while GloVe maps word embeddings into Euclidean space, Word Graph defines the structure of word relationships within a document in non-Euclidean space. This allows Word Graph to reveal 'hidden' connections that traditional numerical methods in Euclidean space might overlook.
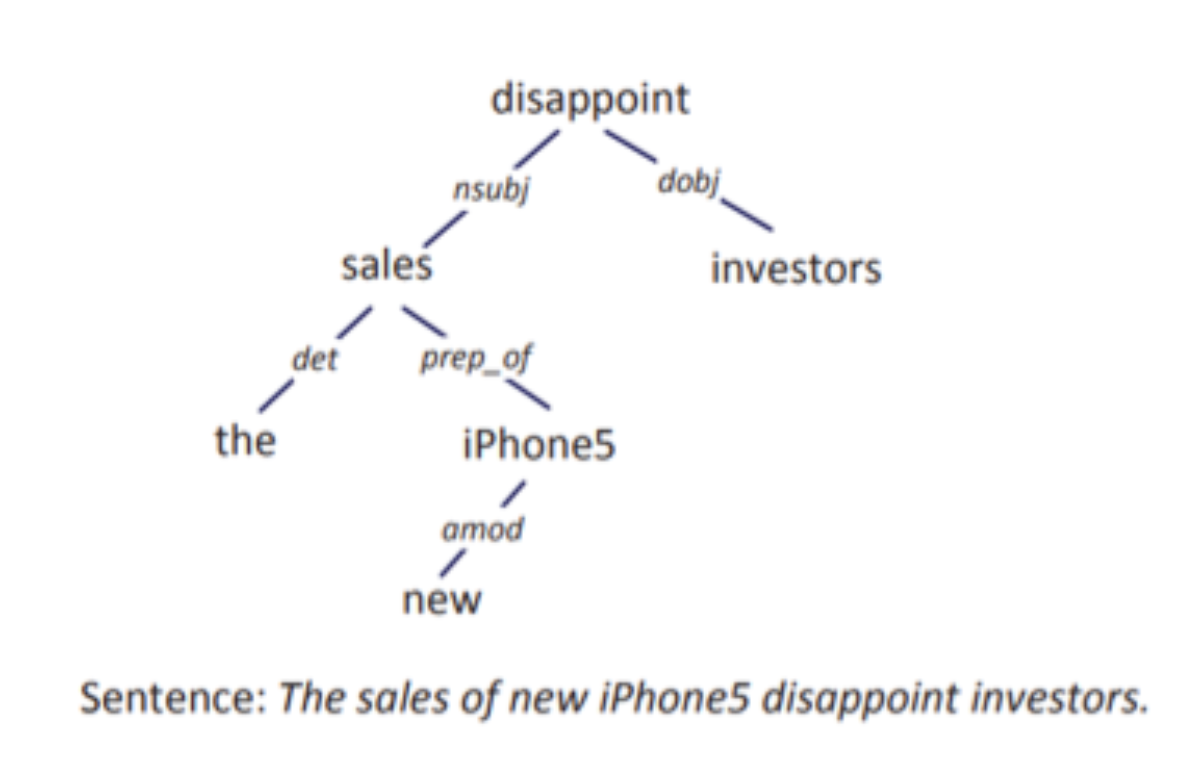
So, how can we calculate the 'structure that represents relationships between nearby words'? To do this, we use a method called Global Random Field (GRF). GRF models the graph structure within a document by using the topic weights of words and the information from the topics associated with the edges that connect the words in the graph. This process helps capture the relationships between words and topics, as illustrated below.

The key point here is that the sum in the last term of the edge does not equal 1. If $w’$ corresponds to topic 1, the sum of all possible cases for $w’’$ would indeed be 1. However, since $w’$ can also be assigned to other topics, we need to account for this. As a result, the total number of edges $|E|$, which acts as a normalizing factor, is included in the denominator.

The GTRF model proposed by Li et al. (2014) is quite similar to GRF. The key difference is that the distribution of topic $z$ is now conditional on $\theta$, with the EM algorithm still being used for both learning and inference. The resulting $p_{GTRF}(z|\theta)$ represents the probability of two topics being related. In other words, it calculates whether neighboring words $w'$ and $w''$ are assigned to the same or different topics, helping to determine the probability of the graph structure.
We have reviewed the foundational keyword embedding techniques used in this study and introduced GTRF, a model that captures 'the relationships between words within topics' through graph-based representation.
Graph Neural Topic Model: Key Differences
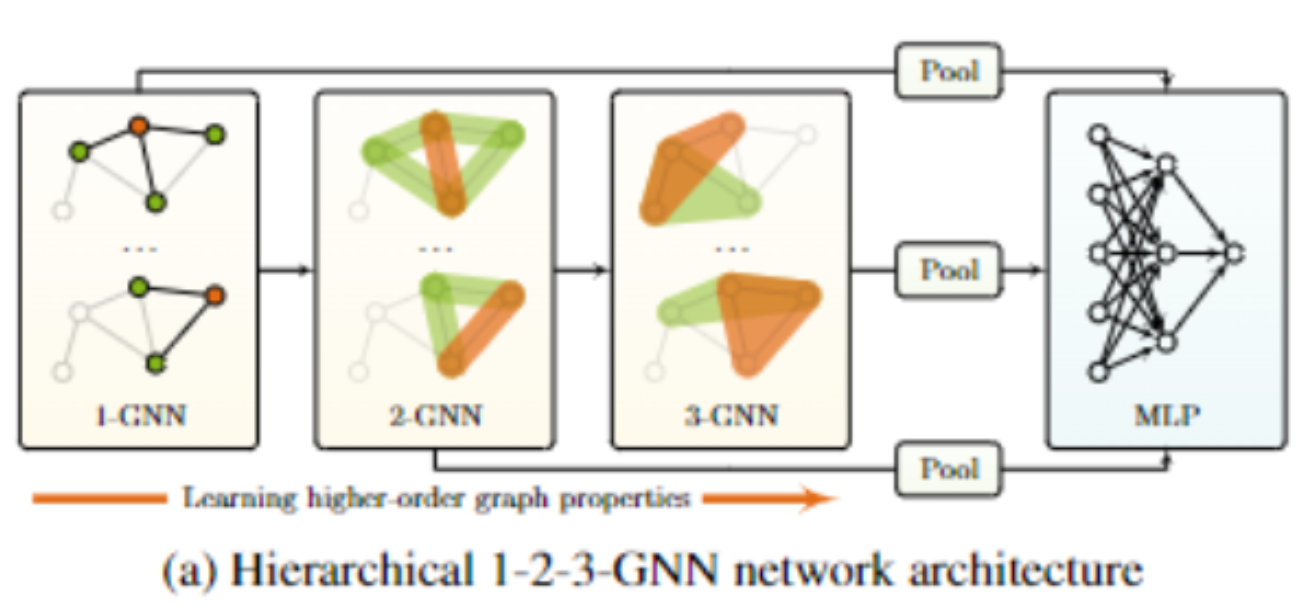
Building on the previous discussion, let's delve into the core of this study: the Graph Neural Topic Model (GNTM). GNTM utilizes a higher-order Graph Neural Network (GNN). As illustrated in the diagram, GNTM increases the order of connections, enabling a more comprehensive understanding and embedding of complex word relationships.
Additionally, GNTM significantly reduces computational costs by utilizing Neural Variational Inference (NVI), rather than standard Variational Inference (VI), to streamline the learning process. Unlike LDA, GNTM introduces an extra step to incorporate 'graph structure' into its calculations, further enhancing efficiency.
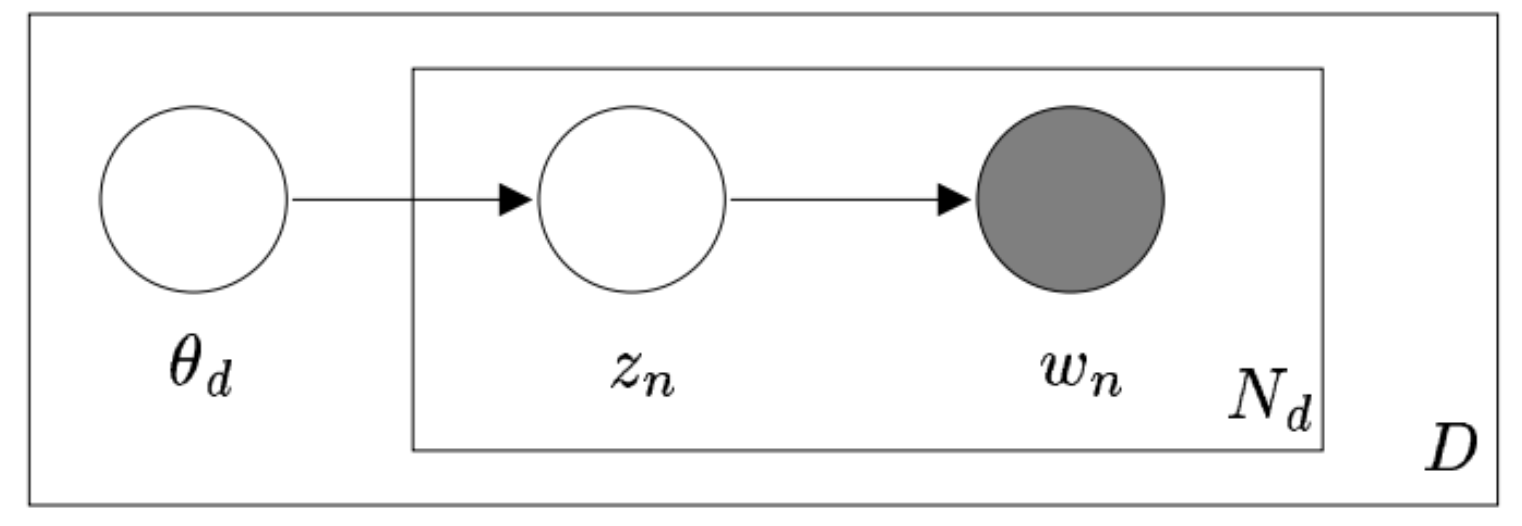
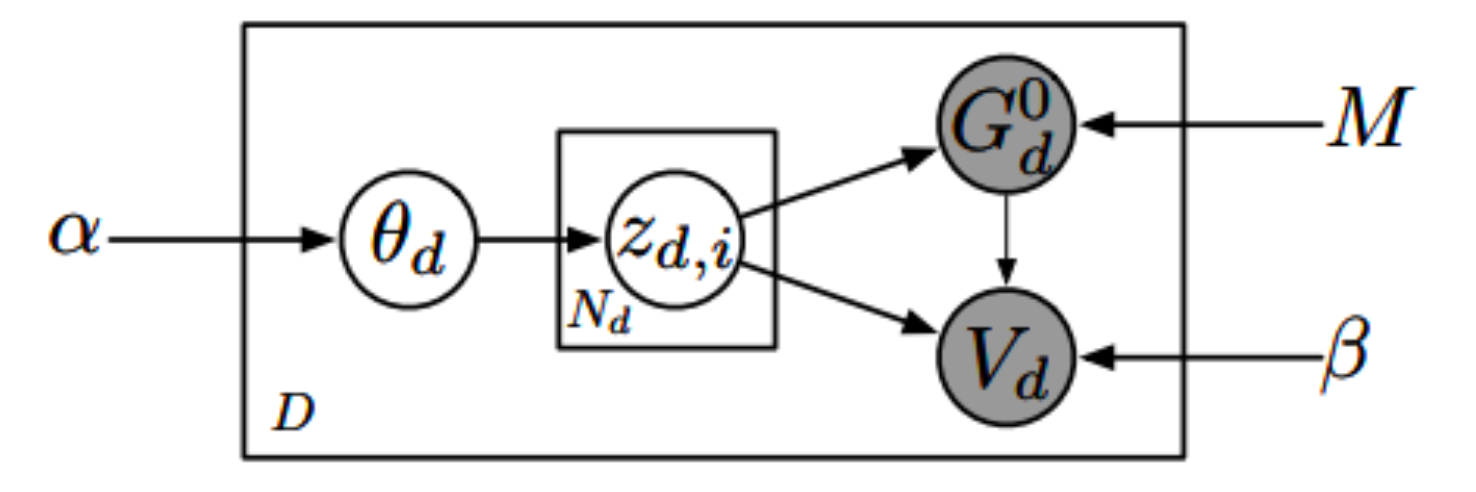
Let’s explore the mechanism of GNTM (GTRF). The diagram above compares the calculations of GTRF and LDA side by side. As previously mentioned, GTRF learns how the structure of $z$ evolves based on the conditional distribution once $\theta$ is determined.
This may seem complex, so let’s step back and look at the bigger picture. If we assume topics are evenly distributed throughout the document, each topic will have its own proportion. We’ll refer to the parameter representing this proportion as $\alpha$.
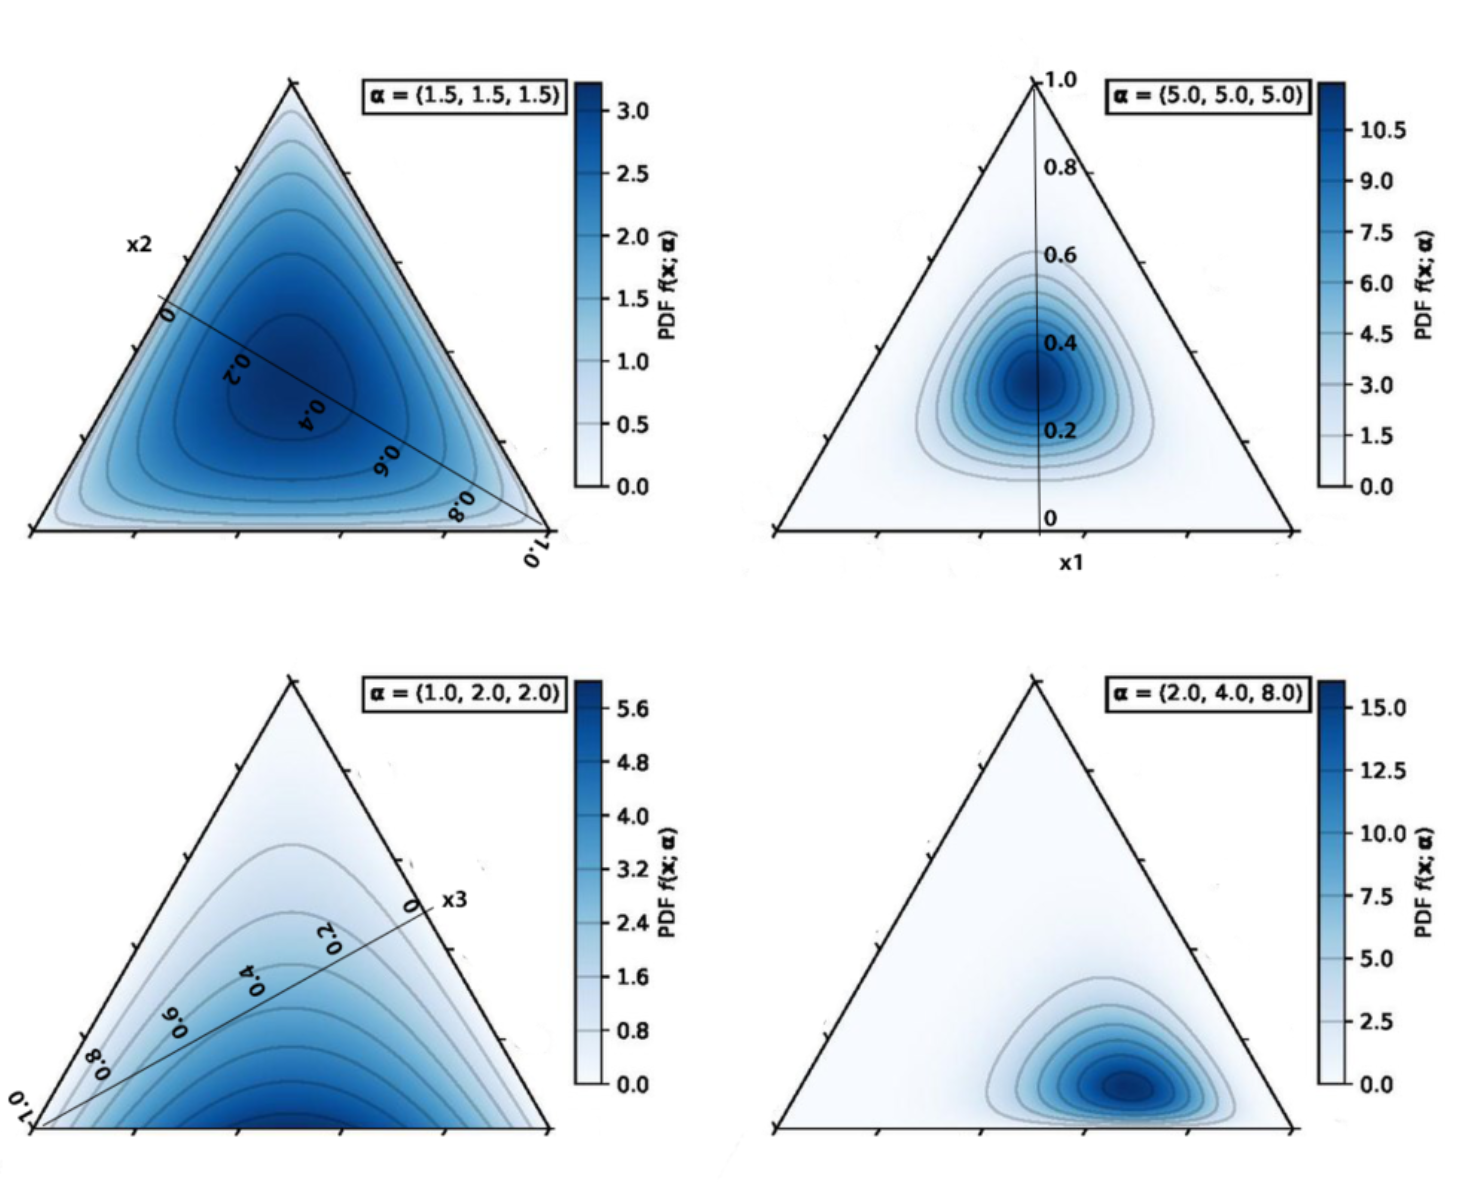
Here, $\alpha$ (similar to the LDA approach) is a parameter that defines the shape of the Dirichlet Distribution, an extended version of the Beta distribution. The shape of the distribution changes according to $\alpha$, as shown below.
After setting the topic proportions using the parameter $\alpha$, a variable $\theta_d$ is derived to represent these proportions. While this defines the ratio, the outcomes remain flexible. Additionally, once the topic $z$ is established, the structure $G$ and word set $V$ are determined accordingly.
First Difference: Incorporating Graphs into LDA
Up to this point, we've discussed the process of quantifying the news information at hand. Now, it's time to consider how to calculate it accurately and efficiently.
The first step is straightforward: set all the parameters of the Dirichlet distribution ($\alpha$) to 1, creating a uniform distribution across $n$ dimensions. This approach assumes equal proportions for all topics, as we don't have any prior information.
Next, assuming a uniform topic distribution, the topic proportions are randomly sampled. Based on these proportions, words in the news articles are then randomly assigned to their corresponding topic $z$. The intermediate graph structure $G$, however, doesn't need to be predefined, as it will be 'learned' during the process to reveal hidden relationships. The initial formula can thus be summarized as follows.

As we saw with GTRF, the probability of a graph structure forming depends on the given condition, in this case, the topic. This is represented by multiplying all instances of $p(1-p)$ from the binomial distribution's variance. In other words, topics are randomly assigned to words, and based on those assignment ratios, we can calculate $m$. With this value, the probability of structures forming between topics is then quantified using the variance from the binomial distribution.
Second Difference: NVI
The final aspect to examine is NVI. NVI estimates the posterior distribution of latent topics in text data. It uses a Neural Network structure to parametrize the algorithm, allowing accurate estimation of the true posterior across various distributions. In the process, it often uses the reparameterization trick from VI to simplify distributions. Using neural networks means NVI can be applied to more diverse distributions than VAE (Variational AutoEncoder), which learns data in lower dimensions. This is supported by the Universal Approximation Theorem, which states that theoretically, any function can be estimated using neural networks.
To explain reparameterization further, it replaces the existing probability distribution with another, representing it through learnable parameters. This allows backpropagation and effective gradient computation. This technique is often used in VAE during the sampling of latent variables.
As mentioned earlier, both VI and NVI use the reparameterization trick. However, NVI's advantage is that it can estimate diverse distributions through neural networks. While traditional Dirichlet distribution-based VI uses only one piece of information, NVI can use two, mean and covariance, through the Logistic Normal Distribution. Additionally, like GTRF, which estimates topic structure, NVI reflects the process of inferring relationships between topics in the model.
So far, we have designed a topic model that maximizes computational efficiency while capturing word context using advanced techniques. However, as my research progressed, one question became my primary concern: "How can this model effectively assist in decision-making?"
The first key decision is naturally, "How many topics should be extracted using the GNTM model?" This is akin to the question often posed in PCA: "How many variables should be extracted?" Both decisions are critical for optimizing the model's usefulness.
Determining the Number of Topics
From a Computational Efficiency Standpoint
Let's first determine the number of topics with a focus on computational efficiency and minimizing costs. During my theoretical studies in school, I didn't fully grasp the significance of computational efficiency because the models we worked with were relatively "light" and could complete calculations within a few minutes.
However, this study deals with a vast dataset—around 4.5 to 5 million words—which makes the model significantly "heavier." While we've integrated various methods like LDA, graph structures, and NVI to reduce computational load and improve accuracy, failing to limit the number of topics appropriately would cause computational costs to skyrocket.
To address this, I compared the computational efficiency when the number of topics was set to 10 and 20. I used TC (Topic Coherence) to evaluate the semantic consistency of words classified into the same topic, and TD (Topic Diversity) to assess the variety of content across topics.
The results showed that when the number of topics was 10, the calculation speed improved by about 1 hour (for Epoch=100) compared to 20 topics, and the TD and TC scores did not drop significantly. Personally, I believe more accurate validation should be done by increasing the Epoch to 500, but since this experiment was conducted on a CPU, not a GPU, increasing the number of Epochs would take too much time, making realistic validation difficult.
There may be suggestions to raise the Epoch further, but since this model uses Adam (Adaptive Moment Estimation) as its activation function, it’s expected to converge quickly to the optimal range even with a lower Epoch count, without significant changes.
From a Clustering Standpoint
In the previous discussion, we determined that 10 topics are optimal from a computational efficiency standpoint. Now, let's consider how many topics would lead to the best "seller-buyer matching"—or how many industries should be identified for overseas buyers to effectively find domestic sellers with relevant offerings—from a clustering perspective.
If the number of topics becomes too large, Topic Coherence (TC) decreases, making it harder to extract meaningful insights. This is similar to using adjusted $R^2$ in linear regression to avoid adding irrelevant variables, or to the caution needed in PCA when selecting variables after the explained variance stops increasing significantly.
As dimensions increase, the "curse of high dimensionality" emerges in Euclidean space. To minimize redundant variables, we utilized clustering metrics such as the Silhouette Index, Calinski-Harabasz Index, and Davies-Bouldin Index, all based on cosine similarity and correlation.
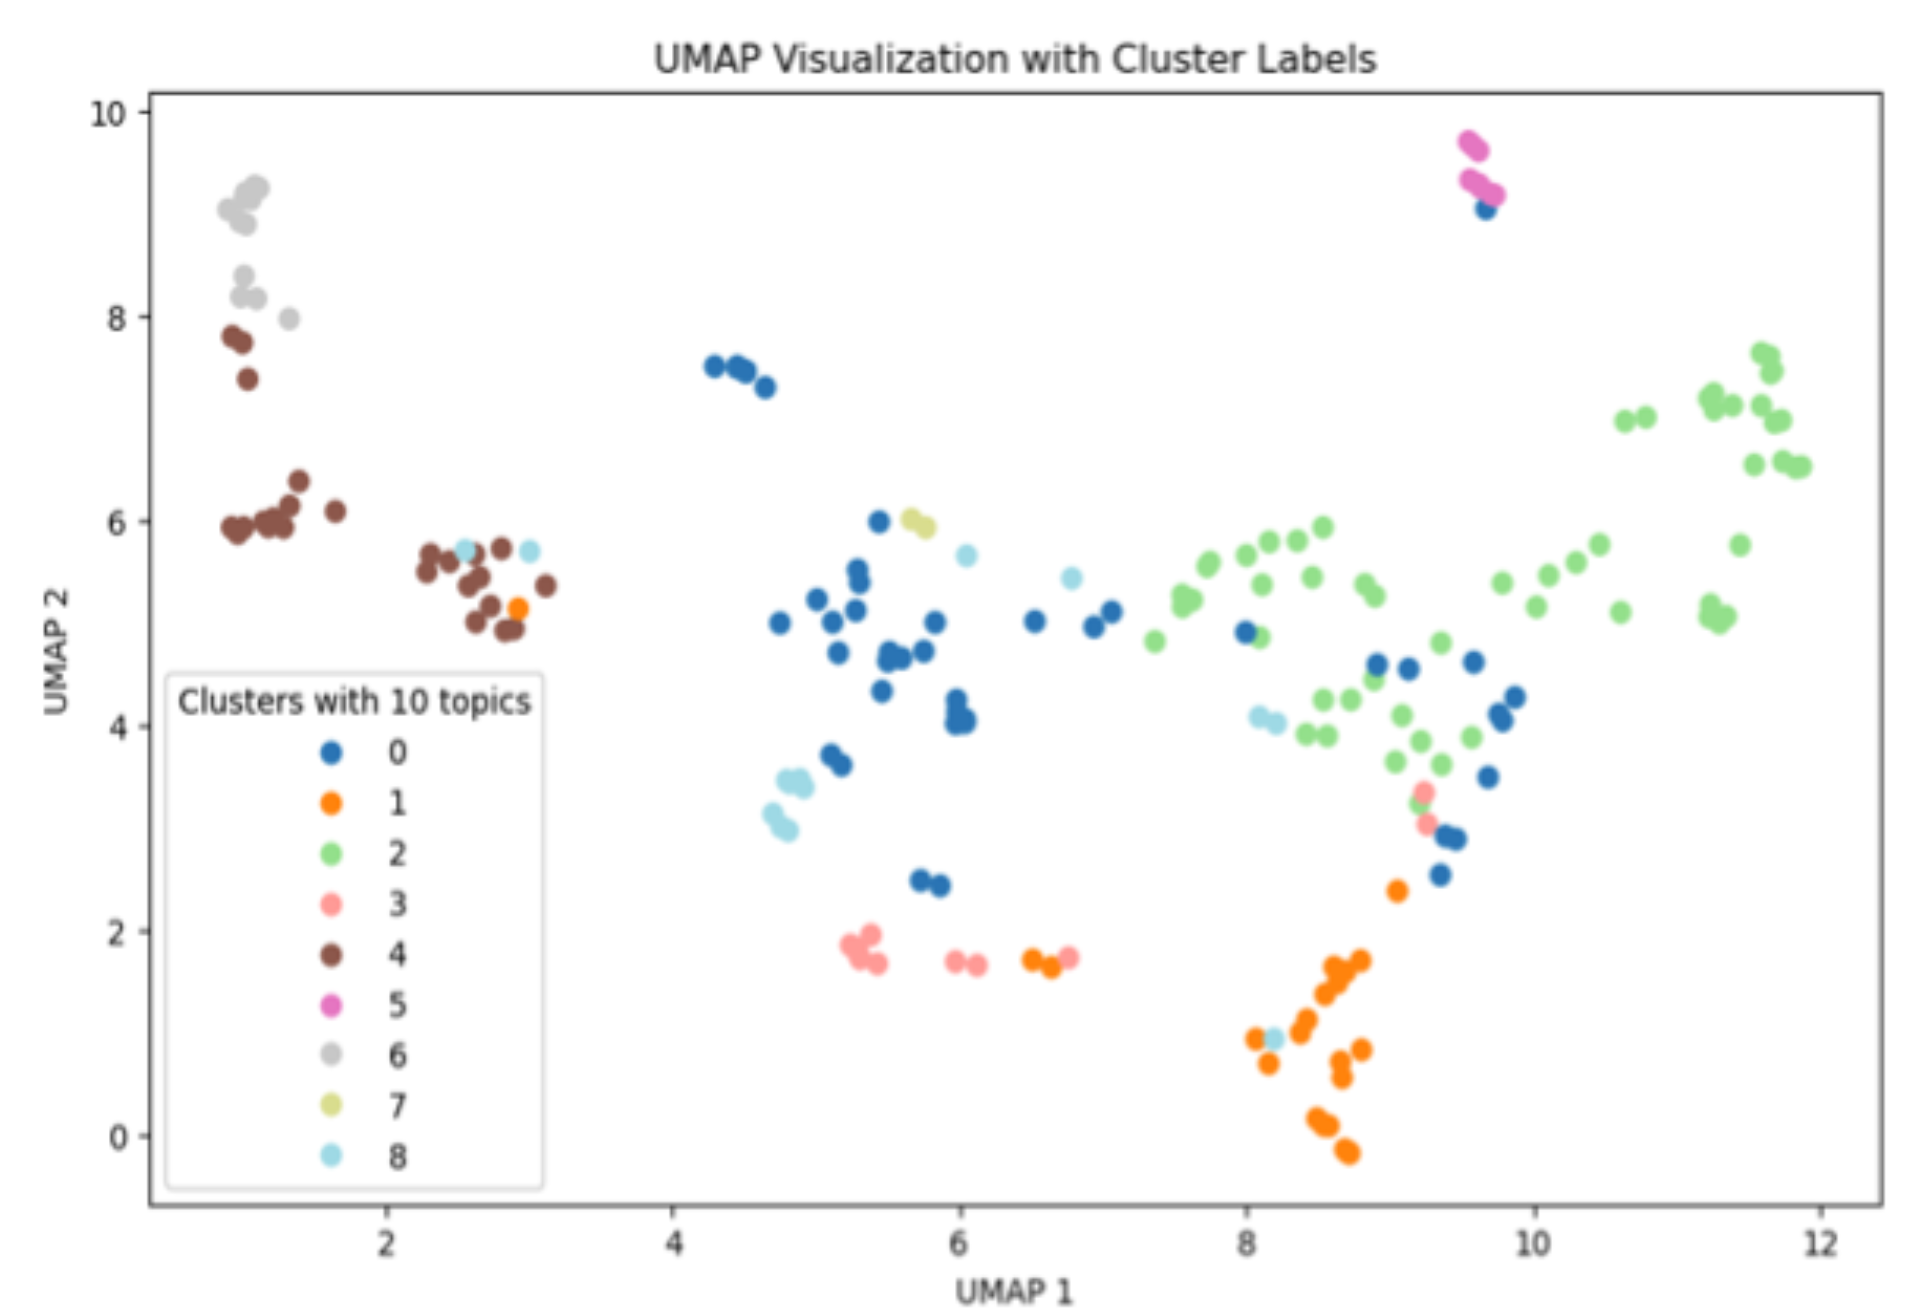
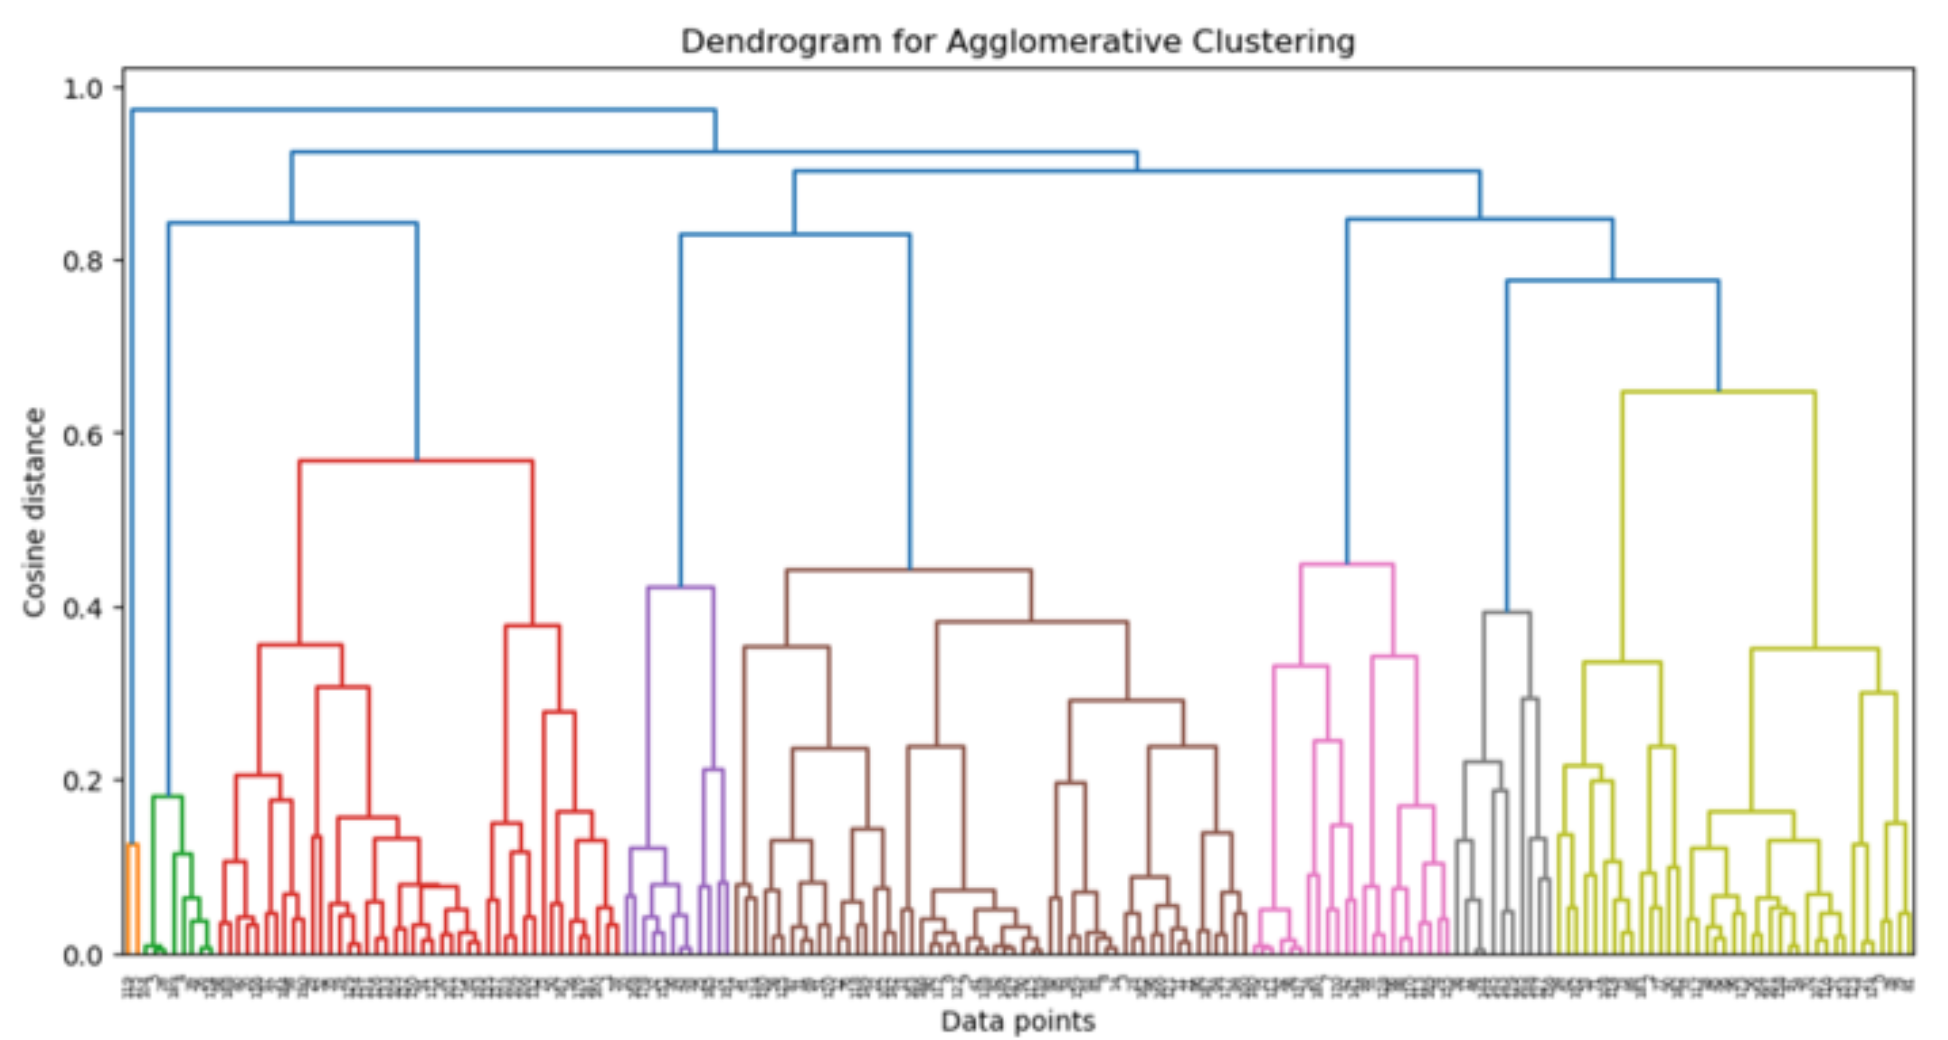
As shown in the figure above, the clustering results indicate that the optimal grouping occurs with 9 topics. This was achieved using agglomerative hierarchical clustering, which begins by grouping small units and progressively merges them until all the data is clustered.
Strengths of GNTM
The key strength of this method lies in its interpretability. By using a dendrogram, we can visually trace how countries are grouped within each cluster. The degree of matching can be calculated using cosine similarity, and the topics that form these matches, along with the specific content of the topics, can be easily interpreted through a word network.
The high level of interpretability enhances the model's potential for direct integration with KOTRA's topic service too. By leveraging the topics extracted from KOTRA's existing export-import data, this model can strengthen the capabilities of an AI-based buyer matching service using KOTRA's global document data. Additionally, the model's structure, calculation process, and results are highly transparent, making decision-making, post-analysis, and tracking calculations significantly more efficient. This interpretability not only increases transparency but also maximizes the practical application of the AI system.
Additionally, the model can be applied to non-English documents. While there may be some loss of information compared to English, as mentioned earlier, GloVe captures similar words with similar vectors across languages and reflects contextual relationships. As a result, applying this methodology to other languages should not present significant challenges.
Furthermore, the model has the ability to uncover hidden nonlinear relationships within the data through UMAP (Uniform Manifold Approximation and Projection) clustering, which goes beyond the limitations of traditional linear analysis. This makes it promising for future applications, not only in hierarchical clustering but also in general clustering and recommendation algorithms.
Summary
In summary, this paper presents an Natural Language Processing (NLP) study that performs nonlinear factor analysis to uncover the topic proportions $\theta$, accounting for the covariance between topics.
In other words, while factor analysis (FA) is typically applied to numerical data, this research extends nonlinear factor analysis to the NLP field, extracting the structure of words and topics, topic proportions, and the prior distribution governing these proportions, effectively quantifying information for each group.
One of the biggest challenges in PCA and FA-related studies is interpreting and defining the extracted factors. However, the 'GNTM' model in this paper overcomes the limitation of 'difficulty in defining factors' by presenting word networks for each topic.
Now, for each topic (factor), we can identify important words and interpret what the topic is. For example, if the words "bank," "financial," "business," "market," and "economic" dominate in Topic 1, it can be defined as 'Investment.'
The paper also optimizes the number of topics in terms of TC (Topic Coherence) and TD (Topic Diversity) to best fit the purpose of buyer-seller matching. The results for the optimized number of topics were visually confirmed using UMAP and word networks.
Lastly, to solve the high-dimensional curse, clustering was performed using metrics based on cosine similarity and correlation.
What about the noise issue?
Text data often contains noise, such as special characters, punctuation, spaces, and unnecessary tags unrelated to the actual data. This model minimizes noise by using NVI, which extracts only important tokens, and by significantly increasing the number of epochs.
However, increasing the number of epochs exponentially raises computational costs. In real-world applications with time constraints, additional methods to quickly and efficiently reduce noise will be necessary.
Applicability
The most attractive feature that distinguishes GNTM from other NLP methods is its interpretability. While traditional deep learning is often called a 'black box,' making it hard for humans to understand the computation process, this model uses graph-based calculations to intuitively understand the factors that determine topics.
Additionally, GNTM is easy to apply. The Graph Neural Network Model, which forms the basis of GNTM, is available in a package format for public use, allowing potential users to easily utilize it as a service.
Furthermore, this study offers a lightweight model that can be applied by companies handling English text data, enabling them to quantify and utilize the data flexibly according to their objectives and needs.
Through UMAP (Uniform Manifold Approximation and Projection), the presence of nonlinear relationships in the data was visually confirmed, allowing for the potential application of additional nonlinear methods like LightGCN.
Moreover, since this paper assigned detailed topic proportions to each document, there is further research potential on how to utilize these topic proportions.
Future Research Direction
Similar to prompt engineering, which aims to get high-quality results from AI at a low cost, the future research direction for this paper will focus on 'how to train the model accurately and quickly while excluding as much noise as possible.' This includes applying regularization to prevent overfitting from noise and improving computational efficiency even further.
To view the article in Korean, please click here.