Jeonghun Song (MSc Data Science, 2023)
With economic uncertainty both domestically and globally, the surge in energy-related raw material prices this winter was 'expected.' Experts are urging the need to accurately predict winter energy consumption and come up with strategies to save energy. However, the industry is questioning the methods previously used to estimate energy consumption, claiming that these methods do not reflect reality.
How can energy consumption be predicted accurately? What other impacts could come from accurately predicting energy usage? This article aims to explain a statistical method based on the joint probability distribution model to predict energy consumption more realistically in simple terms for the public.
Global Raw Materials Supply Crisis
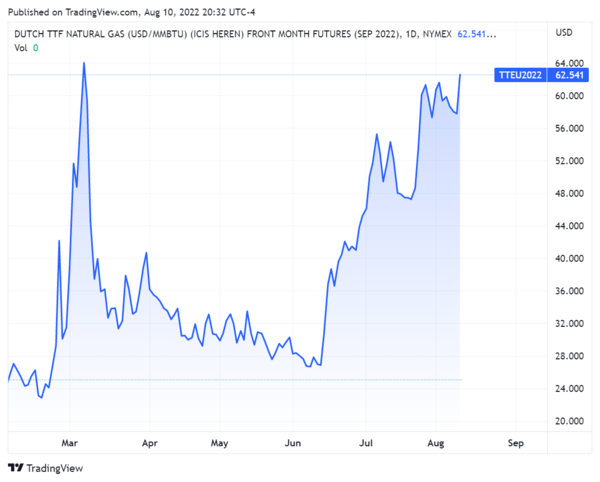
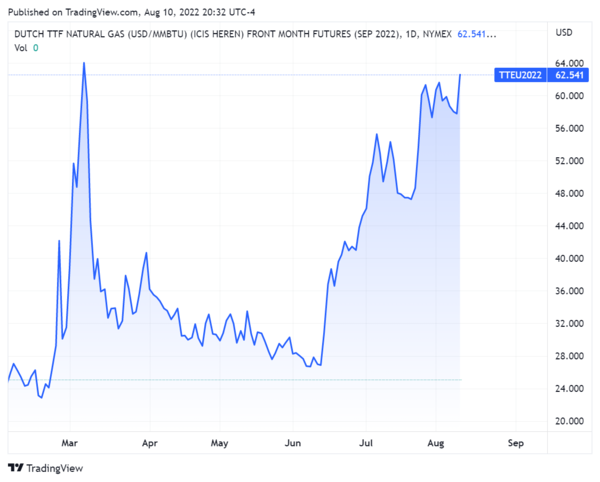
According to the Chicago Mercantile Exchange (CME) on August 11, the spot price of European LNG surged to \$62.5 per MMBtu on August 2. This is 6 to 7 times higher than last year’s \$8-10 for the same period and close to the record high of \$63 set in March of this year.
Experts believe the sharp rise in European LNG prices is due to Russia’s 'tightening' of natural gas supplies. Amid the ongoing Russia-Ukraine war, the West, including the U.S., has refused to pay for raw materials in rubles, pressuring Russia. In response, Russia has significantly reduced its natural gas supply.
In fact, Russia has completely halted natural gas supplies to Bulgaria, Poland, the Netherlands, Finland, Latvia, and Denmark, all of which refused to pay in rubles. At the end of last month, it also drastically cut the supply through the Nord Stream 1 pipeline to Germany, its biggest customer, to 20%. As Europe struggles with gas shortages, it has been pulling in all available global LNG, driving up Northeast Asia’s LNG spot prices to $50 as of July 27.
Adding to the LNG supply crisis, a June explosion at the U.S.'s largest LNG export facility, Freeport LNG, which exports 15 million tons of LNG annually, has limited operations until the end of the year. Meanwhile, Australia, the world’s largest LNG exporter, is considering restricting natural gas exports under the pretext of stabilizing raw material prices. As a result, the industry expects a 'dark period' in raw material supply in the second half of this year.
The problem is that these geopolitical issues are severely impacting South Korea’s raw material supply as well. Even in the low-demand summer and fall seasons, LNG spot prices are nearing record highs, and the industry consensus is that winter, with its heating demands, will see prices rise to unimaginable levels.
'Predicted' Energy Crisis
Experts warn that in this 'predicted' energy crisis, the winter LNG spot price may far exceed the record high of \$63 per MMBtu from March, possibly surpassing \$100. They emphasize that South Korea must accurately forecast winter energy consumption now and begin conserving resources through energy-saving measures.
So, how is energy consumption in South Korea estimated, and how accurate are these estimates? To understand this, we first need to examine how electricity and gas are consumed in the country.
Energy consumption, including electricity and gas, occurs not only in households but also in non-residential buildings such as office and commercial facilities. The energy use in non-residential buildings varies greatly depending on the building's purpose. According to the "Energy Usage by Purpose [kWh/y]" data from the New and Renewable Energy Center of the Korea Energy Agency, there are significant differences in energy consumption depending on the building’s use.
Additionally, using the 'average energy consumption per unit area' from the table below, we can estimate the total annual energy consumption of a specific building. This is calculated by multiplying the annual average usage figure for the building’s purpose by its total floor area. For example, the estimated annual energy consumption for an office building with a floor area of 1,000 square meters would be 371,660 kWh.
\begin{array}{c|c|c|c|c|c|c|c} \hline \textbf{Office} & \textbf{Sales/Business} & \textbf{Medical} & \textbf{Education/Research} & \textbf{Elder Care} & \textbf{Accommodation} & \textbf{Religious} \ 371.66 & 408.45 & 643.52 & 231.33 & 175.58 & 526.55 & 257.49 \ \hline \end{array}
Widely Used Energy Consumption Estimates
These energy consumption estimates for individual buildings can be widely applied. As we’ve seen, with energy raw material prices expected to hit record highs, these estimates can help ensure that 'expensive' energy is not wasted and is efficiently distributed.
Additionally, the Korea Energy Agency, which provided the above data, actively uses these statistics to calculate the required amount of renewable energy for public buildings. For example, when a public building is scheduled for new construction or expansion and plans to generate a certain amount of renewable energy, the energy consumption estimates are compared to the expected energy output. This comparison helps determine whether the building is producing enough renewable energy.
Moreover, these energy usage estimates are not limited to individual buildings but can be extended to areas or regions. For instance, if a large-scale building or new city district is planned within a specific urban area, regional energy demand will naturally increase as the buildings are constructed.
However, a limitation of this data is that the estimates rely on a simple one-variable regression, with energy consumption as the dependent variable and floor area as the independent variable. In reality, building energy consumption is influenced by various factors such as heating and cooling systems, building materials and structure, and insulation quality. Thus, explaining energy use based solely on 'floor area' reduces accuracy.
Therefore, government agencies and public corporations responsible for energy management must strive to estimate the increased energy demand from new buildings as accurately as possible. This is crucial for efficient decision-making related to energy supply, production, and infrastructure investment. A precise model to estimate energy consumption for individual buildings is clearly necessary for this purpose.
Existing Energy Estimation Studies Based on Regression Analysis
Ideally, accurately estimating a building’s energy consumption would involve analyzing all detailed characteristics, such as heating and cooling systems, building materials and structure, insulation, occupancy, and schedules. This type of estimation model is known as a Physical Model.
However, predicting energy usage using a physical model is not practical. Most construction companies do not disclose all information, especially for new buildings. While collecting this data directly from the builders may be possible for a single building, doing so for an entire district or region would result in astronomical costs.
Therefore, from a research perspective, it’s best to use a statistical model that estimates energy consumption based on a few simple building attributes. In other words, creating a regression model where the dependent variable is a building's energy consumption, and the independent variables are attributes such as floor area, purpose, number of floors, age, and materials.
Regression analysis is a well-known statistical method for identifying correlations between observed independent variables and a dependent variable. Researchers can use regression analysis to statistically test how much a change in an independent variable influences the dependent variable and, further, predict the dependent variable's value from the independent variables. To ensure a reasonable analysis, researchers must also consider mathematical and statistical assumptions, such as whether their model violates the Gauss-Markov assumptions. Details on these considerations will be discussed in the later part of this research.
To conduct regression model research with monthly energy consumption of individual buildings as the dependent variable, data is required. In South Korea, monthly energy consumption records for non-residential buildings are made available through the Building Data Open System. Information about building attributes, which serves as independent variables, is recorded in the title section and is also provided by the Building Data Open System. This allows anyone to combine monthly energy consumption data with title section data to carry out such research.
Returning to the main point, due to the practical 'cost' issue and the ease of data collection for regression model research, previous studies estimating energy consumption of individual buildings have primarily used regression-based statistical models. A notable domestic study is “Development of Standard Models for Building Energy in Seoul’s Residential/Commercial Sector” (Kim Min-kyung et al., 2014). This research derived a model by performing linear regression on monthly electricity usage with various independent variables and monthly dummy variables (which convert existing variables into 0s and 1s based on certain criteria). Similarly, in a prominent overseas study on heating energy estimates, a model was derived by regressing 'per unit area' monthly heating energy consumption during the heating season against building and climate-related independent variables.
Monthly' Energy Usage Trends
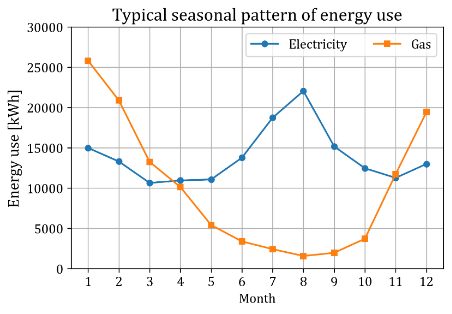
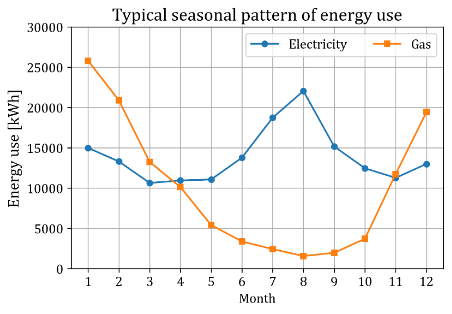
One common feature of the studies reviewed earlier is that the dependent variable in the regression models is not 'annual' energy consumption, but 'monthly' energy consumption. This is to reflect the seasonal trends in energy usage. For example, electricity usage is higher in the summer due to air conditioning, and gas consumption is higher in the winter due to heating. It’s no surprise that electricity usage peaks in July and August, while gas consumption is highest from December to February. In fact, most buildings exhibit similar 'seasonal trends' in energy consumption, as shown in Figure 3.
Therefore, when planning energy supply and maintenance for energy production facilities, it is crucial to accurately predict monthly energy demand by considering seasonal fluctuations. This ensures that sufficient energy is available during high-consumption periods to prevent blackouts, and that energy reserves are minimized during low-consumption periods, allowing for efficient use of government budgets. However, previous studies' energy consumption estimates have not been widely adopted in the industry due to their lack of accuracy and failure to reflect reality. This is because traditional regression models did not incorporate a 'joint' probability distribution model based on the second moment for monthly energy usage.
Hidden Factors Among Variables
Consider two hypothetical office buildings with nearly identical attributes but differing actual energy usage. Both buildings are categorized as office buildings, with similar floor area, number of floors, age, and building materials. However, in one building, employees frequently work overtime and on weekends, using air conditioning extensively, resulting in high electricity consumption. In contrast, the other building emphasizes energy saving, with employees leaving on time daily, leading to much lower energy use.
In this case, even though the explanatory variable values for the two buildings are very similar, their actual electricity usage would differ significantly. The first building would use more electricity compared to the average office building of similar size and materials, while the second would use less. This means that the energy consumption of two buildings with identical attributes like floor area, number of floors, and materials would vary due to the hidden variable of "whether employees leave on time." Since it's practically impossible to collect data on the work hours of all employees in a building, including this variable in existing models is not feasible.
Of course, regression analysis accounts for such variability through the error term. The energy consumption of average buildings is calculated by setting the error term to zero, while buildings that consume more than average will have a positive error term, and those that consume less will have a negative one.
Correlation Among Dependent Variables
In proper research, not only are the coefficient estimates for each explanatory variable provided in a regression model, but so is the estimate of error variance. Using this error variance estimate, the expected energy usage for each month can be obtained as both a point estimate and a confidence interval. In a normal regression model, this confidence interval would cover most of the variability in energy usage mentioned earlier. However, mathematically, one more factor needs to be considered: the 'correlation among energy usage in different months.'
For example, if the electricity consumption in August of a building that frequently has overtime and uses a lot of air conditioning is significantly higher than other similar-sized buildings, it is likely that this building will also consume more electricity in other months, from January to December, compared to other similar buildings. Similarly, if a building that focuses on energy saving has low electricity usage in August, it will likely consume less electricity in other months as well.
This is mathematically referred to as a 'positive correlation.' Previous regression-based studies did not account for this positive correlation. For instance, if we assume that monthly electricity usage follows a probability distribution with the average usage predicted by the existing regression model, and we draw samples of monthly electricity usage for a specific building, it's possible that the sample value for July might be much higher than average, while the sample value for August could be much lower than average.
Common sense tells us that a building that used significantly more electricity than similar buildings in July is unlikely to use much less electricity than other buildings in August. In other words, if the regression model captures all relevant information, the samples of electricity usage for July and August for the same building should be positively correlated—they should both be high or both be low. However, if there is no second moment value (i.e., 'covariance') between the error terms for the two months, such unrealistic samples may occur.
Covariance Among Error Terms
Let’s examine this more mathematically. When viewing the monthly electricity usage (January, February, ..., December) for a building over a year as a 12-dimensional vector random variable, previous studies have estimated the first moment vector and the diagonal components of the second moment matrix (the variance of error terms for each month). The first moment vector is obtained by inputting the explanatory variable values into the regression equation and setting the error term to zero. The diagonal components of the second moment matrix correspond to the estimated variances of the error terms for each month. However, previous studies did not estimate the off-diagonal components of the second moment matrix—i.e., the 'covariance' between the error terms of different regression equations—leading to difficulties in accurately modeling real-world scenarios.
If, in addition to calculating the first moment vector, the second moment matrix with covariances is fully estimated, the multivariate normal distribution (Multivariate Normal Distribution) of the multivariate random variable can be defined mathematically. In practical terms, this would allow us to sample monthly electricity usage for a specific building while accounting for the 'correlation between energy usage in different months.' This way, a building that uses significantly more electricity than similar buildings in July would also be expected to use more electricity in August.
These accurately generated samples (monthly energy estimates) can greatly help urban energy-related research by allowing statistical analysis of uncertainties. Additionally, if some monthly energy usage data are missing, the second moment matrix can be used to estimate (impute) the missing values, thereby significantly improving the quality of the data.
However, for the multivariate normal distribution to be defined in this context, the research data must be nearly symmetrical around the mean, and the tails of the distribution must not be excessively thick or thin. Furthermore, the 2021 building data (energy usage, floor area, building purpose, etc.) used in this discussion are generally in line with these assumptions.
Sample Extraction Using Multivariate Normal Distribution
By defining the multivariate normal distribution based on the second moment matrix, it is possible to extract samples of monthly energy usage (January, February, ..., December) for an entire year. This approach differs from previous studies because it accounts for the correlation between residuals in the regression model, thus incorporating 'seasonal trends' when generating samples. In simple terms, a building that used significantly more electricity than similar buildings in July can now also be estimated to use more electricity in August.
Example Reflecting Covariance
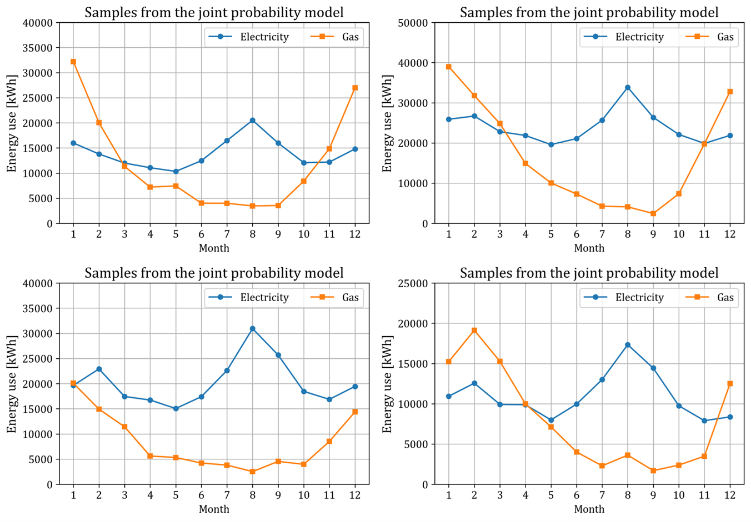
To validate this claim, let's examine the energy usage data samples drawn from the multivariate normal distribution in the figure below.
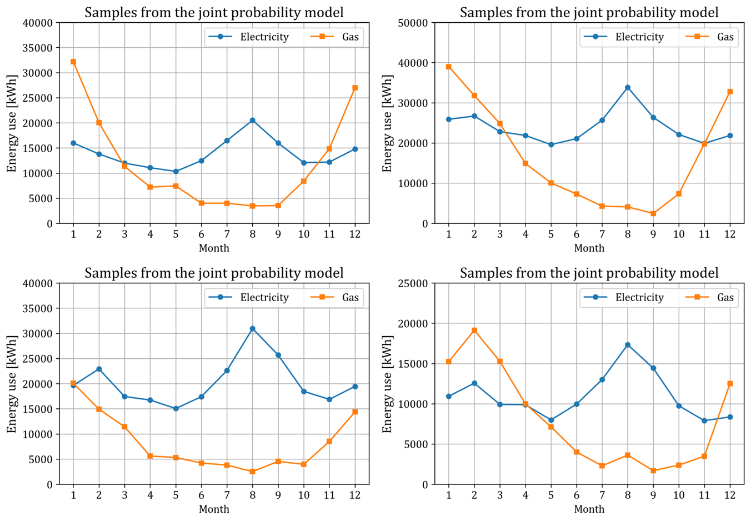
The figure shows that the seasonal energy usage trends in the samples are very similar to the actual data. For example, electricity consumption rises significantly during the summer months (July-August) when air conditioning is heavily used, while gas consumption increases during the winter months (December-February) when heating is in high demand. This confirms that our statistical model accurately reflects reality.
Example Without Covariance
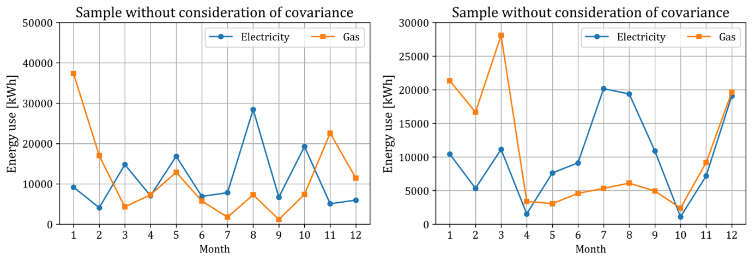
Now, let’s see what happens when we extract samples without considering the covariance between energy usage in different months, as in previous studies. This is equivalent to setting the off-diagonal elements of the covariance matrix to zero in the multivariate normal distribution used for the sample extraction.
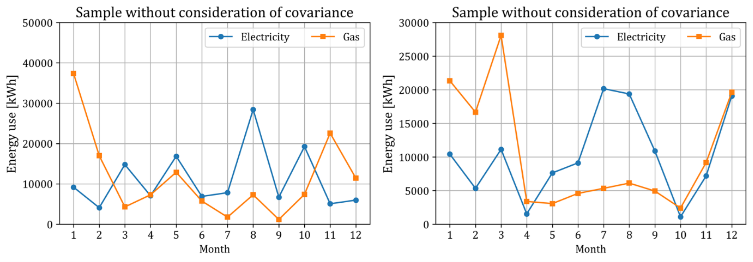
If a building exhibits significantly lower energy usage in July, it would be reasonable to expect that it consistently uses less energy, meaning its August usage should also be below average.
However, in this case, the model failed to incorporate the covariance information, leading to unrealistic results. As illustrated in the first figure, a building that consumed much less electricity than similar buildings in July unexpectedly uses much more electricity in August compared to others, which defies typical expectations.
Missing Data Estimation Using Multivariate Normal Distribution
In addition to sample extraction, another application is missing data estimation (imputation). For example, the Ministry of Land, Infrastructure, and Transport data sometimes has missing monthly energy usage for certain buildings, or some recorded values may be abnormal. If correct usage data exists for the other months, can we estimate the missing usage based on the recorded values?
If energy usage is recorded for the first and last months of a three-month period, but missing for the second month, we might compromise by using the middle value. But what if two consecutive months are missing? Or if the last month's usage is missing, so the middle value cannot be defined using the following month's data? What should be done then?
\begin{equation} \label{eq:conditional-mvn} \left[\begin{matrix} z_1\ z_2 \end{matrix}\right] {\sim}MVN \left(\left[\begin{matrix} \mu_1\ \mu_2 \end{matrix}\right] , \left[\begin{matrix} {\scriptstyle\sum}_{11} & {\scriptstyle\sum}_{12}\ {\scriptstyle\sum}_{21} & {\scriptstyle\sum}_{22} \end{matrix}\right]\right) \Rightarrow\ P\left(z_1\middle| z_2=a\right)=MVN \left(\mu_1+ {\scriptstyle\sum}_{12} {\scriptstyle\sum}_{22}^{-1} \left(a-\mu_2 \right), {\scriptstyle\sum}_{11}- {\scriptstyle\sum}_{12} {\scriptstyle\sum}_{22}^{-1} {\scriptstyle\sum}_{21} \right) \end{equation}
Using the multivariate normal distribution derived in this study, missing values can be reasonably estimated in any case. As shown in the formula, when some elements of a random vector following a multivariate normal distribution are fixed, the remaining elements follow a reduced-dimensional conditional multivariate normal distribution based on the fixed values. This allows us to estimate the missing values using the conditional mean of this distribution.
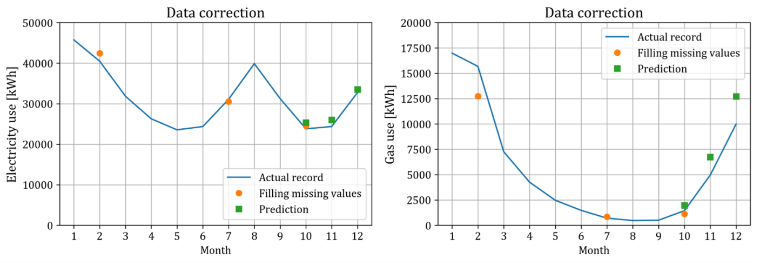
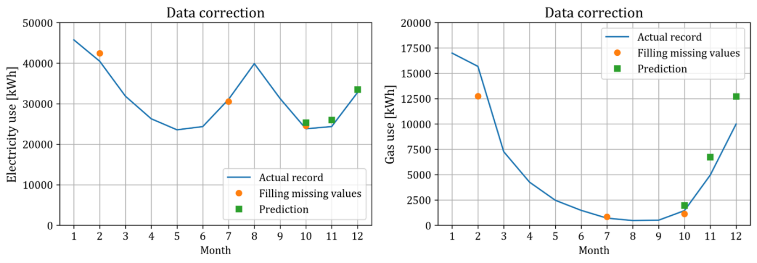
The graph above shows missing values filled in using the conditional mean of the multivariate normal distribution. The blue solid line represents the actual monthly energy usage of a building, while the orange circles represent the conditional mean for February, July, and October, assuming these months' usage is missing. The green squares represent the conditional mean for October to December, assuming the usage from January to September is given, which can be viewed as future usage predictions. The conditional mean does not deviate much from the actual values, indicating that using the conditional mean to estimate missing values is reasonable.
All in all, accurate energy consumption forecasting requires a statistical approach that goes beyond simple regression models, taking into account the correlations between various variables and complex factors. By using a multivariate normal distribution model, it is possible to make more realistic predictions by considering the correlations between monthly energy consumption, which can improve the efficiency of energy supply planning. This approach can also be useful for addressing statistical errors overlooked in previous studies and for imputing missing data. Ultimately, more accurate energy consumption forecasting will serve as crucial foundational data for preparing for winter energy crises, while also contributing to improving energy efficiency and preventing resource waste.
To view the article in Korean, please click here.
